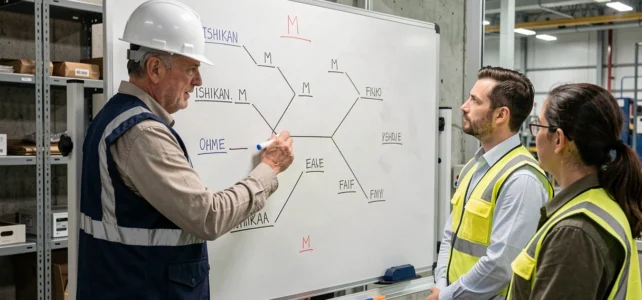
The 5M method structures the analysis of the causes of an industrial problem around five categories: Manpower, Material, Equipment, Method, and Environment. Used since the 1960s, it remains one of the most utilized tools in quality management. The question today is no longer whether it works, but under what conditions it produces sustainable results, and when it shows its limits.
5M vs 6M: what the shift to six categories changes in the analysis
Several recent industrial frameworks now consider the 6M as the standard in manufacturing. The sixth category, often called “Measurement,” includes control instruments, metrological reliability, and data collection biases. Its absence in the classic five-branch model creates a blind spot when a defect arises not from the product itself, but from how it is measured.
| Criterion | 5M Model | 6M Model |
|---|---|---|
| Analysis Categories | Manpower, Material, Equipment, Method, Environment | The 5M + Measurement |
| Metrological Coverage | Absent or diluted in Equipment | Dedicated category for sensors, instruments, calibrations |
| Main Usage Sectors | Food industry (HACCP), services, health | Industrial manufacturing, automotive, electronics |
| Risk of Blind Spot | Unidentified measurement bias | Increased complexity of the diagram |
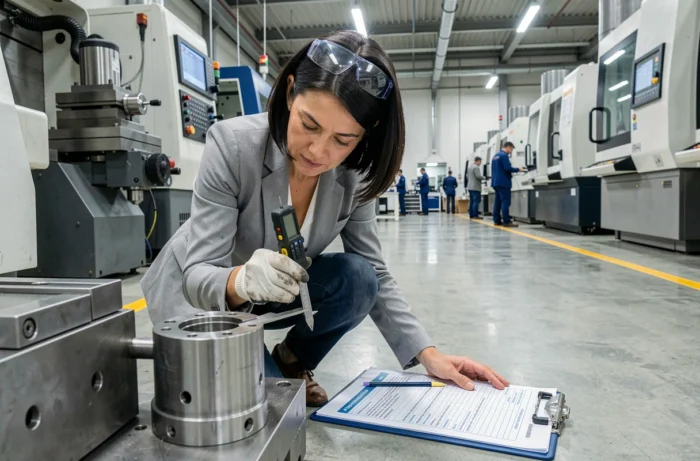
When a dimensional defect recurs despite corrective actions on Equipment and Method, the problem sometimes lies in a poorly calibrated sensor or an unsuitable measurement protocol. Adding the Measurement branch prevents treating a metrological symptom as a product defect.
For teams already working with the 5M quality method in its classic form, transitioning to the 6M does not require a complete overhaul. It is enough to systematically isolate the causes related to measurement instead of categorizing them as defects in Equipment.
Ishikawa Diagram and Data Validation: the Trap of Brainstorming Without Evidence
The fishbone diagram remains a powerful visual tool for generating group hypotheses. Several industrial guides published between 2024 and 2026 point out a usage that reduces its scope: stopping at the fishbone without confronting the hypotheses with the actual process data.
The scenario repeats in many companies. A brainstorming workshop produces a rich Ishikawa diagram, with dozens of potential causes spread across the five branches. The team selects the causes that seem most likely, launches corrective actions, and finds a few weeks later that the defect persists.
From Hypothesis Generator to Factual Analysis
The Ishikawa diagram should function as a hypothesis generator to be validated, not as a conclusion tool. Each cause identified on a branch calls for verification through data: machine logs, statistical process control (SPC) charts, maintenance histories, temperature or humidity records.
- A “Manpower” hypothesis (insufficiently trained operator) is verified by cross-referencing the defect rate by team and position over several weeks
- A “Environment” hypothesis (too variable workshop temperature) is confirmed or invalidated with IoT sensor readings or MES system data
- A “Material” hypothesis (non-compliant raw material batch) is tested by comparing supplier certificates to receiving inspection results
This articulation between the cause-and-effect diagram and data collection transforms a group exercise into a measurable improvement process. Without data, the fishbone produces action plans based on collective intuitions.
Common Errors in Cause Analysis with the 5M
Most articles on the 5M method describe the five categories and provide a step-by-step guide. They address less the recurring errors that neutralize the effectiveness of the tool in real contexts.
Confusing Cause and Consequence on the Diagram
Placing “high scrap rate” on a branch of the Ishikawa diagram amounts to listing a consequence among the causes. The error seems obvious when stated this way, but it often appears in less visible forms: “insufficient quality of parts” on the Material branch, for example, describes an effect, not an actionable cause. Each item listed on a branch must be subject to a direct corrective action.
Overloading One Branch, Neglecting Another
Teams tend to concentrate causes on the branches they know best. In a production workshop, the Equipment branch accumulates hypotheses while the Method branch remains almost empty. This imbalance reflects a bias of expertise, not the reality of the problem.
An effective facilitator imposes a minimum reflection time per branch before moving on to the next. This forces the team to explore categories they might have spontaneously overlooked, particularly the Environment (environmental conditions, spatial organization) and Manpower (skills, communication between positions).

Integrating the 5M into a Sustainable Quality Approach
Using the Ishikawa diagram occasionally after an incident is not enough to sustainably reduce non-conformities. The tool gains its full value when it is part of a continuous improvement cycle, coupled with other analysis methods.
Combining the 5M with the 5 Whys allows one to descend from the primary cause (identified on a branch) to the root cause. A “Equipment: poorly adjusted machine” calls for a first why (setting not checked at the start of the shift), then a second (checklist absent), then a third (procedure never formalized). The diagram locates the area, the 5 Whys dig down to the root cause.
Companies that connect their Ishikawa diagram to a digital collection system (MES, IoT sensors, QHSE software) gain speed in validation. Instead of waiting for the next occurrence of the defect to verify a hypothesis, they directly query the historical data of the process.
The 5M method does not produce results solely through its graphic structure. Its value depends on the rigor with which each hypothesis is formulated, verified, and followed by a measurable action. A well-constructed but unused diagram remains a group exercise with no effect on the defect rate.